Application of Landsat to examine the land surface temperature
GISTDA analyzes and evaluates Thermal Wave data, by presenting the “land surface temperature” (in degree Celsius) to study the difference of land surface temperature between the target area and surrounding area, which have different land use characteristics, such as residential zone, commercial buildings, industrial plants, agricultural land, and community areas, as well as to study impact of the land use changes on the land surface temperature.
The measuring of land surface temperature by using data from Landsat 5 TM, Band 6 (wavelength range of 10.44 – 12.42 nanometers) with 120-meter spatial resolution, and data from Landsat 8 TIRS, Band 10 (wavelength range of 10.60 – 11.19 nanometers) or Thermal Infrared wavelengths with 100-meter spatial resolution, in the form of Level-1 data which has gone through radiometric and geometric correction on GeoTIFF Format.
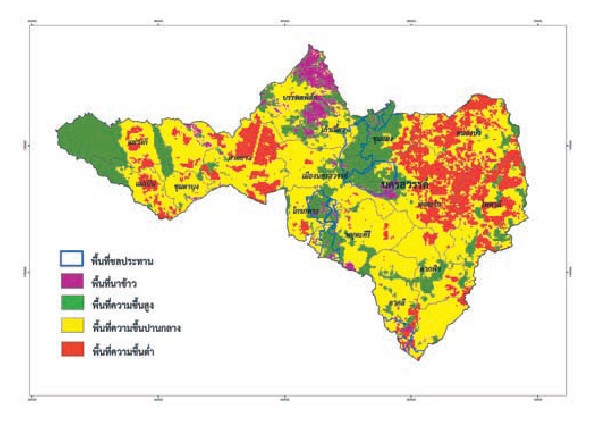
The land surface temperature images from satellite data can show the distinguished difference of land surface temperature due to the types of land use and the things that cover the land. The residential and community areas, as well as industrial factories that have their land surface covered with concrete, wood, zinc, and some open space, including the burned area in agricultural land, will have rather high land surface temperature, while the aquaculture area, wetland area, and water resources will have lower surface temperature.
Moreover, the study of land surface temperature of Inner Bangkok and nearby areas through periodic satellite data in the span of 20 years found that the land surface temperature has risen by an average of two degree Celsius, as a result of land use change. The previous land use was mostly for agricultural purpose, but after Bangkok expansion, the inner city has been occupied with the increased construction of residential areas and commercial buildings. When comparing the satellite data with the temperature values measured by the Meteorological Department over the same period, it is found that both groups of data are related to each other.

The sample of land surface temperature images

The study of land surface temperature of Inner Bangkok and nearby areas through periodic satellite data in the span of 20 years

Land surface temperature map from Landsat-8 TIRS, Band 10 data, recorded on September 14, 2014, and superimposed data with natural color composite. Data from Thaichote, recorded on October 10, 2013.